[ad_1]
- Activities related to NFT trading and staking ensured the rise in dApp activity.
- While new demand for ETH fell, withdrawals from exchanges jumped.
Ethereum [ETH] stood out from the many blockchains available after its dApp volume increased by 92.43% in the last seven days. For context, dApp stands for decentralized Applications.
They are applications that operate on a blockchain network while using smart contracts to power trading and user interaction. In most cases, low transaction fees bring about a surge in volume.
Ethereum beats BNB Chain, others to the spot
This is because users do not have to pay exorbitant fees to facilitate the exchange of tokens or transfers. However, during Ethereum’s era of high transactions fees, there were time it outperformed other chains in this regard.
But this time, the dominance could be linked to the cheap gas fees enabled by the Dencun upgrade which took place in March. At press time, Ethereum’s dApp volume was $71.13 billion.
This value was much higher than BNB Chain, Polygon [MATIC], and the Tron [TRX]. However, one thing AMBCrypto noticed was that it was not an all-round increase with the applications.
For example, dApps like Blur, EigenLayer and Uniswap [UNI] NFT Aggregator registered notable hikes. However, others including Uniswap V2 and V3 could not match up as they noted declines.
This data suggested that there was a lot of NFT trading and staking that impacted the rise in volume. But trading of tokens on the blockchain were nowhere near those heights.
Therefore, it was not surprising that there was a notable decrease in the network’s UAW. This is an acronym for Unique Active Wallet. It is a term used to measure user engagement and activity.
If it increases, it means that user activity is high. But a decrease suggests a fall in active transactions, and that was the case with Ethereum.
ETH caught in between two sides
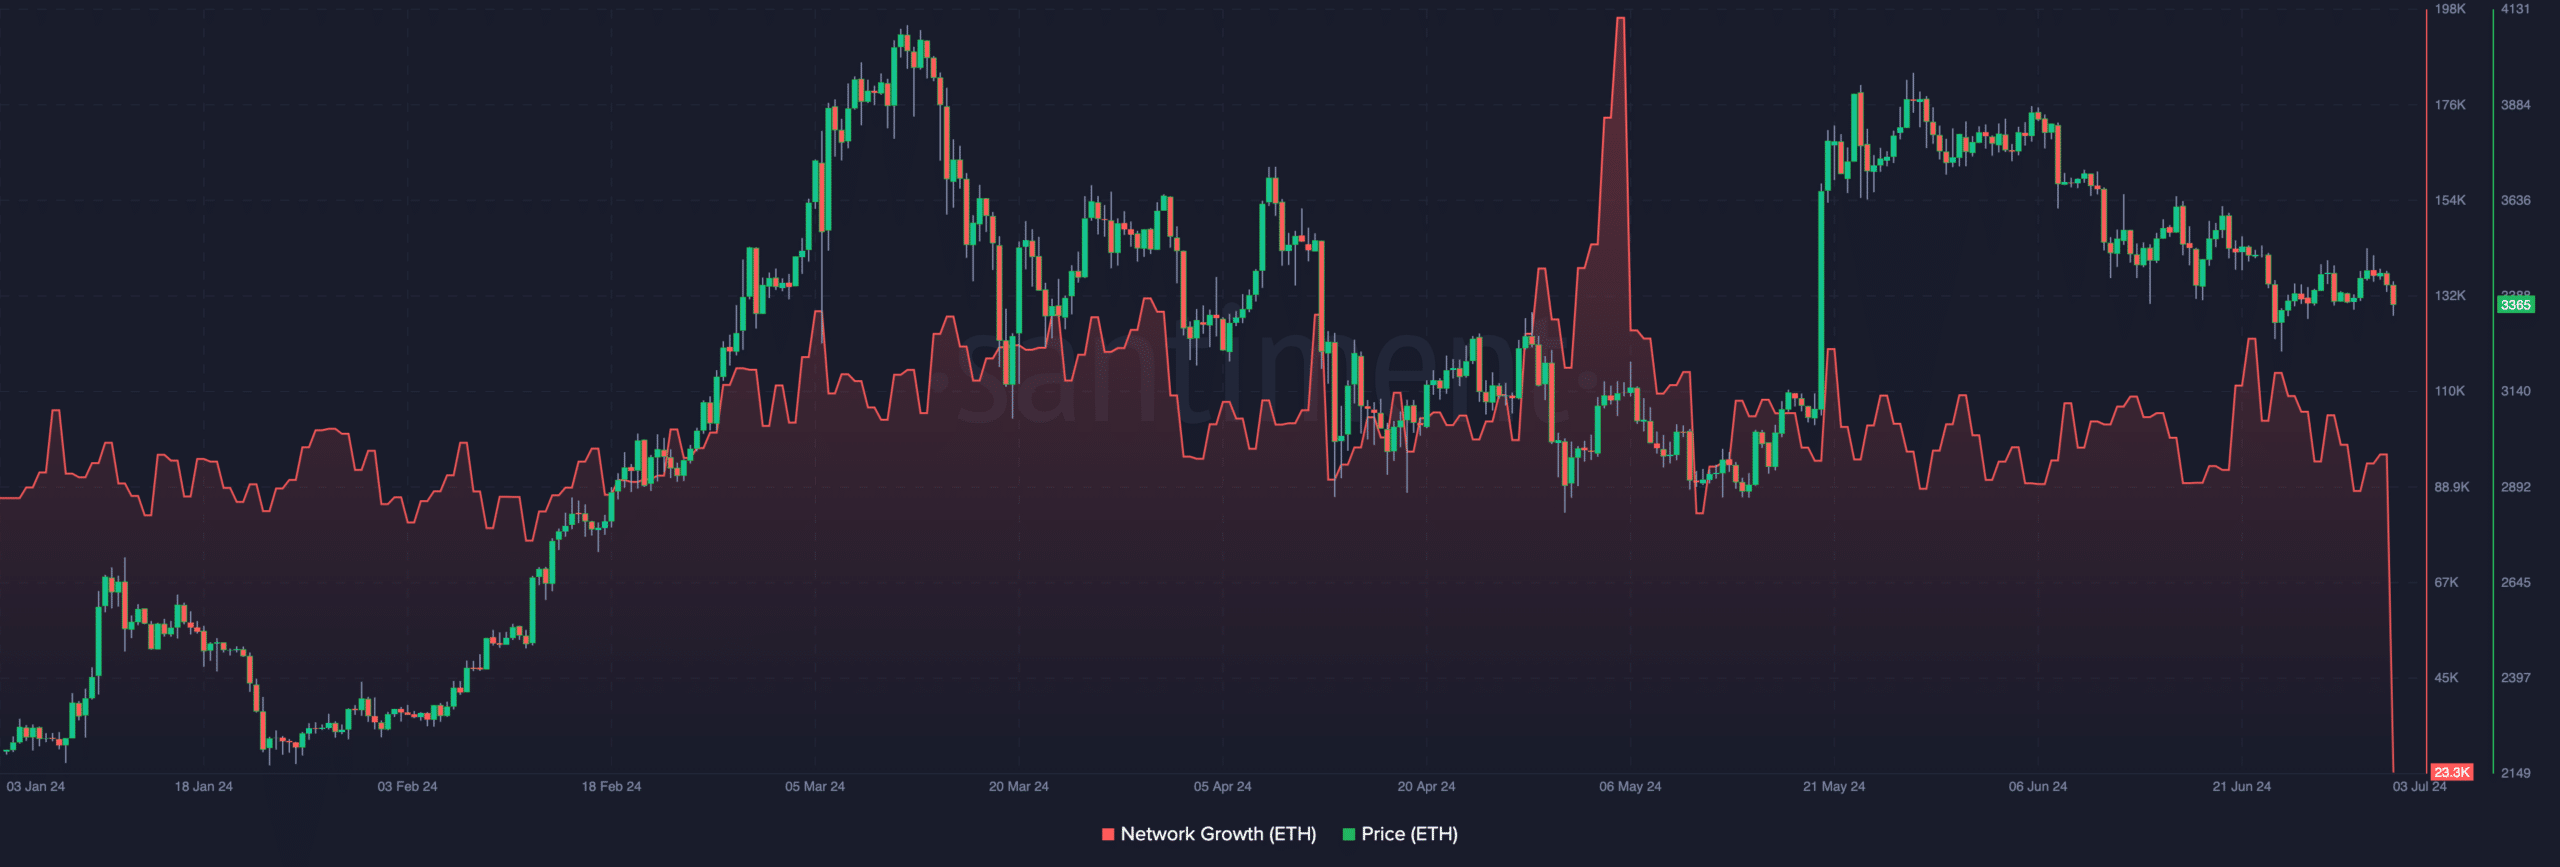
Meanwhile, ETH’s price changed hands at $3,365 which was a 2.32% decrease in the last 24 hours.
As it stands, the price of ETH might continue to experience a decrease or trade sideways despite optimism that the token would perform well this month.
One reason for this prediction is Ethereum’s Network Growth. According to AMBCrypto’s analysis, the blockchain’s Network Growth was down to 23,300.
This metric measures the number of new addresses making their first successful transaction.
If the number increases, then the blockchain is getting good traction. However, a decrease implies that adoption is low, which seems to be the case with ETH.
Historically, when Network Growth rises, it does not take long for ETH’s price to jump. The opposite happens when the number of new addresses fall.
As mentioned before, it is possible to sell ETH drop from $3,300 in the short term.
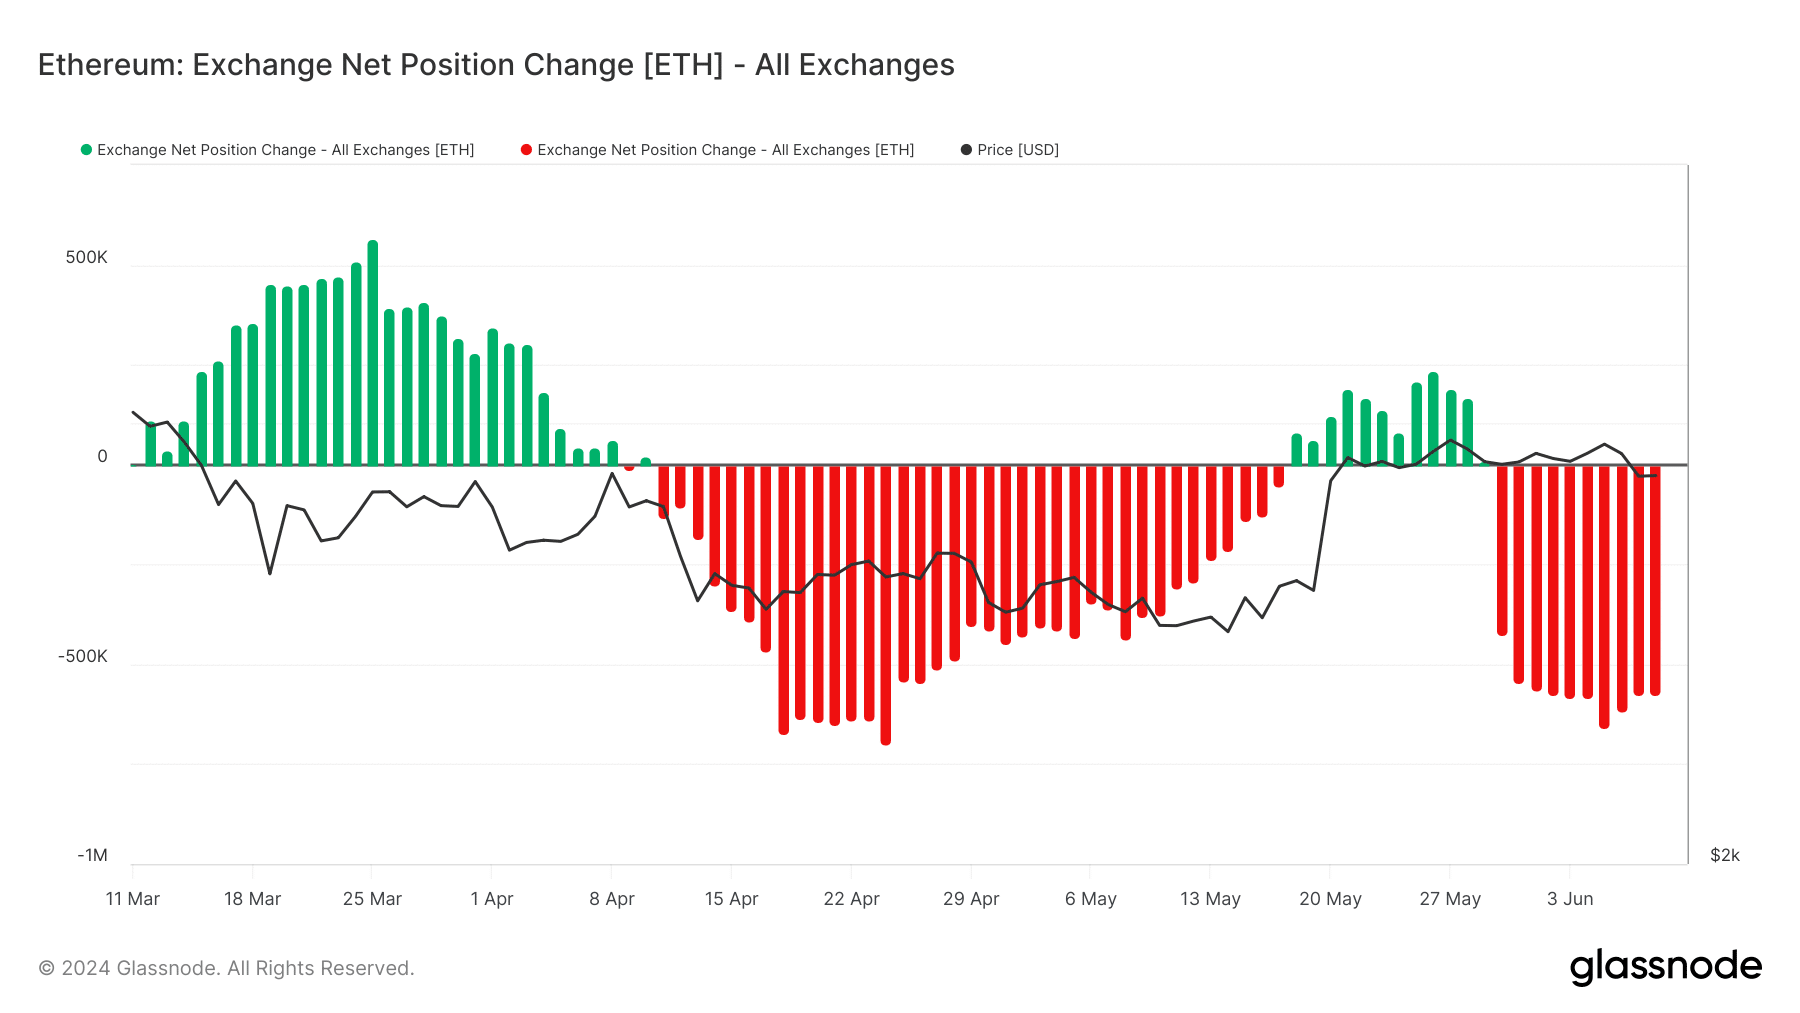
Despite the bearish outlook in the short term, the long-term looks promising for ETH. This was because of the Exchange Net Position Change on Ethereum.
This metric tracks the 30-day supply of cryptocurrencies held in exchange wallets.
When it increases, it means deposits on exchanges are rising, increasing the likelihood of sell-offs. However, a decrease means withdrawals, and tilts toward fewer selling pressure.
Read Ethereum’s [ETH] Price Prediction 2024-2025
According to Glassnode, ETH holders have been removing their assets from exchanges for some months. If this continues, it could provide stability for ETH’s price.
So, ETH could target hitting $4,000 this quarter or surpassing its all-time high.
[ad_2]
Source link


