[ad_1]
- Solana’s network activity remained high in May
- SOL’s price action was bullish, but sentiment around it turned bearish
Solana [SOL] has been in the limelight lately owing to its achievements in the NFT ecosystem. However, that’s not all, with recent datasets revealing that the blockchain has excelled in yet another domain after it flipped Bitcoin [BTC].
Solana’s high network activity
SolanaFloor, a popular X handle, recently tweeted that the blockchain managed to overtake Bitcoin in terms of revenue generated in the last 24 hours. To be precise, SOL generated $1.65 million in revenue, while BTC generated ‘just’ $1.5 million.
The reason behind this performance could be Solana’s robust network activity.
AMBCrypto’s analysis of Artemis’ data revealed that SOL’s network activity remained high in May. Not only did its daily active addresses climb sharply, but SOL’s daily transactions also spiked on 10 May. Here, it’s worth noting that the same fell soon after.
The hike in network activity helped the blockchain generate more revenue. We found that SOL’s fees have risen sharply since the beginning of May, allowing its revenue to also grow.
Everything in the DeFi space also looked pretty optimistic as its TVL hiked. Additionally, SOL dominated BTC heavily in terms of network activity.
Both SOL’s daily transactions and addresses remained considerably higher than those of BTC. In fact, SOL’s fees remained higher than BTC’s, as the latter’s number witnessed a major drop on 7 May.
Apart from this, SOL has been performing well in the NFT ecosystem as well. AMBCrypto had reported previously that there has been a slight hike in Solana NFT volumes over the last seven days, primarily driven by top collections.
SOL remains bullish
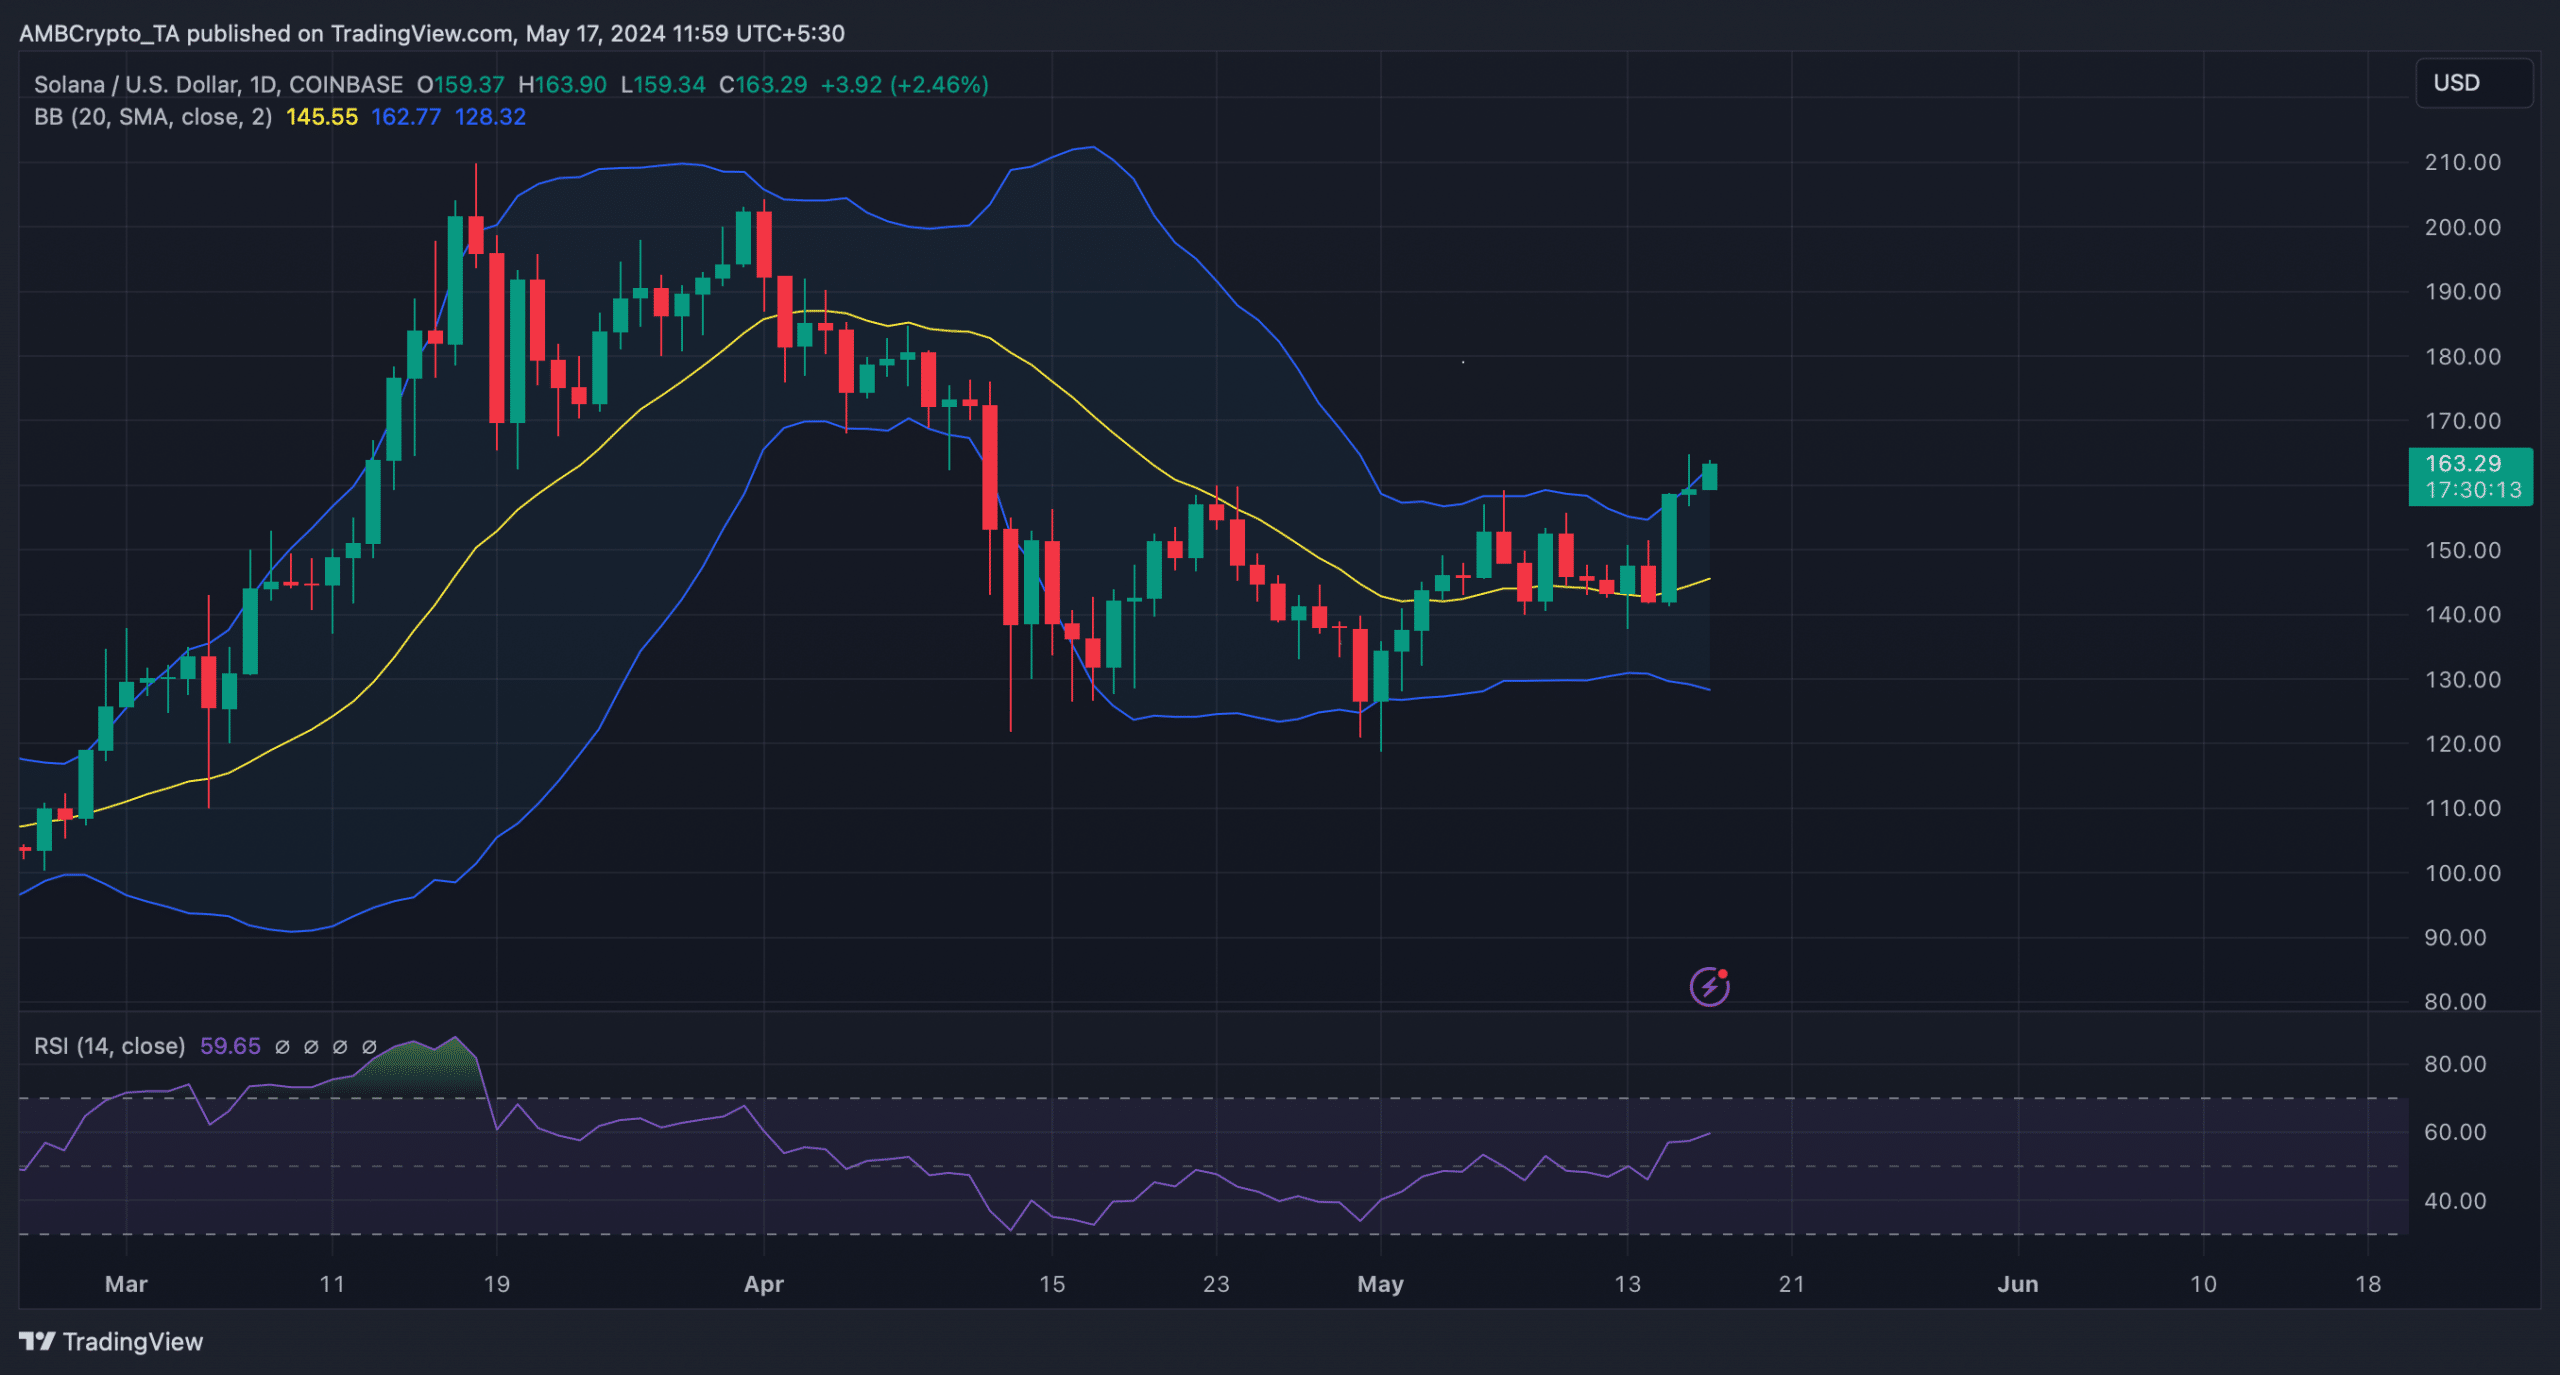
In the meantime, Solana bulls stood strong in the market as its weekly chart remained green. According to CoinMarketCap, SOL has appreciated by over 5% in the last seven days. At the time of writing, the token was trading at $163.26 with a market capitalization of over $73.27 billion.
Thanks to the price uptick, Solana’s social volume hiked over the last few days. However, it was surprising to see a drop in SOL’s weighted sentiment.
Is your portfolio green? Check out the Solana Profit Calculator
AMBCrypto then checked SOL’s daily chart to see whether this uptrend would continue. As per our analysis, SOL’s Relative Strength Index (RSI) registered an uptick and seemed to be heading further away from neutral 50 – Sign of a sustained uptrend.
However, the token’s price had touched the upper limit of the Bollinger Bands – A sign of prospective selling pressure.
[ad_2]
Source link


